On World Backup Day, we often think about protecting our data by creating copies of important files, but one crucial aspect that gets overlooked is power backup. A reliable backup system is not just about storing data—it’s also about ensuring that power outages don’t interrupt your ability to access, update, or restore that data. Whether you’re working from home, running a business, or simply safeguarding personal files, a power backup plan is essential to prevent data loss during sudden blackouts or voltage fluctuations.
Investing in an Uninterruptible Power Supply (UPS) for your computer and external storage devices can give you the extra time needed to save your work and shut down safely. For businesses and data centers, backup generators and battery backup systems provide continuous power in case of extended outages. Cloud storage is another great solution, but remember that without power, local access to your network and internet might be compromised. So, as you secure your files today, take a moment to ensure you have a robust power backup strategy in place—because a backup is only useful if you can access it when you need it most.
At Power Inspired, we offer a range of high-quality UPS solutions to keep your systems running during power interruptions. Whether you need protection for a single workstation or a full-scale business operation, you can browse and buy our UPS products online. Don’t wait for the next outage—stay powered and protected with Power Inspired.
It was an August Friday, there was a sense of
urgency prior to the blackout: people skipping around starting their weekend or
at least the endorphins were being released with the anticipation that R&R
was imminent for those that had the weekend off.
This Friday was different, just before 5pm trains halted and traffic lights glitched in central London- there was a metaphoric handbrake placed on everyone’s journeys. A blanket of darkness swept over parts of England & Wales on the late afternoon of 9 Aug. 2019. Chaos engulfed the regular journey home for many London commuters whether they were sat in their cars or were wading through busy mainline stations.
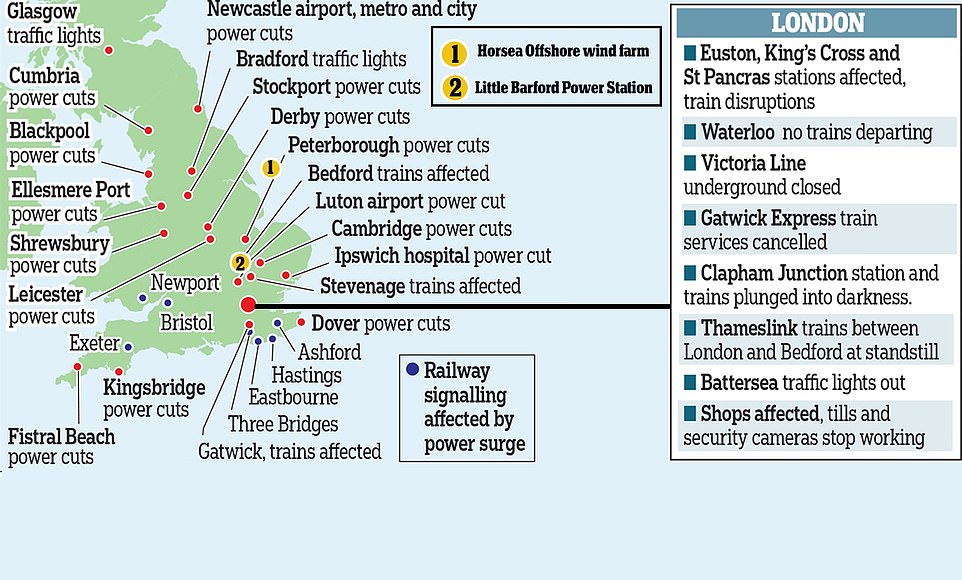
Walking through Cardiff around the same time you’d hear masses of security alarms going off like a Mission Impossible movie. Newcastle homes and businesses were affected and the local airport announced flight cancellations. Not all of the power outages on that day can be attributed to the causes discussed herein, the recorded blackouts are visible in the map below.
Source: https://www.dailymail.co.uk/news/article-7343681/Government-launches-probe-mysterious-power-cut.html Power cuts registered on 9-8-19
You might be thinking ‘how can a train problem in London Euston simultaneously affect traffic lights in Bradford but have no significant power disturbances in between?’ Diverse areas of England and Wales, in terms of proximity, and with disparate tenures were affected that Friday. I was in Oxford and had no inkling, no horror movie like lights out or quietness as my fridge cutout conveying powerlines downing. The question may not bother you longer than a few seconds, because you know about the National Grid, right. You may have mapped out a plan that if it ever happened you’d start walking home and if it went on for hours you’d be forced into eating the contents of your fridge before they spoiled.
If you want to understand a little
bit more about your electricity supply and get an insight into what is keeping
the WiFi signal alive here’s a high level intro to the events of that evening.
Along your read there is a bit of technical knowledge needed regarding AC power network. Where power demand is greater than power generated then the frequency falls. If the generated power is greater than the demand then the frequency will rise. Once the frequency fluctuates to a level outside the set tolerance 50Hz +/-1% any service or appliance connected to the grid will experience instability and/or damage. Hence, frequency changes are monitored and balanced meticulously by controlling demand and total generation. There’s a website here if you want to see what is happening right now.
Watt happened then?
1.1m customers experienced a problem, blackouts on this scale are rare. Even the energy watchdog Ofgem demanded a report. It was released a couple of weeks ago and some of the findings are mentioned here.
Key Connected Personnel
Did the fact that it was 5pm on a Friday and certain connected people had started their weekend have anything to do with it? Only in terms of operational communications. There’s a protocol stating a sequence of communications must be released. Owing to the incident being on a Friday it is believed that certain key members were not readily available however it’s a red herring to believe this had an impact on the nationwide extent of the powercut. The important decisions were left to the Electricity System Operator (ESO) control office that manages the response in such situations.do trains stop during a electricitytrains stop
Electricity demand
The ESO had forecast demand, expecting it to be the same as the previous Friday. Post-event analysis whereby the demand profiles for the two days were mapped shows almost identical dips and rises. Nothing to point the finger at here. It’s not like Love Island airing and causing a surge in demand like earlier on in 2019. That particular increase in demand caused the grid to switch onto coal-powered generation after the longest stint of fossil-free power generation. (Like we needed a reason to dislike that program.) Incidentally, that record still stands at 18 days, 6 hours and 10 minutes. To date this year, we have prevented 5m tonnes of carbon dioxide(source = Guardian) being released into the atmosphere. Greta would be pleased to know.
The electric generation for the day was as expected, humans are creatures of habit so consumption was predictable, and it was known that neither wind nor solar was going to break any records. The generation mix was as per any regular day in August.
The Weather
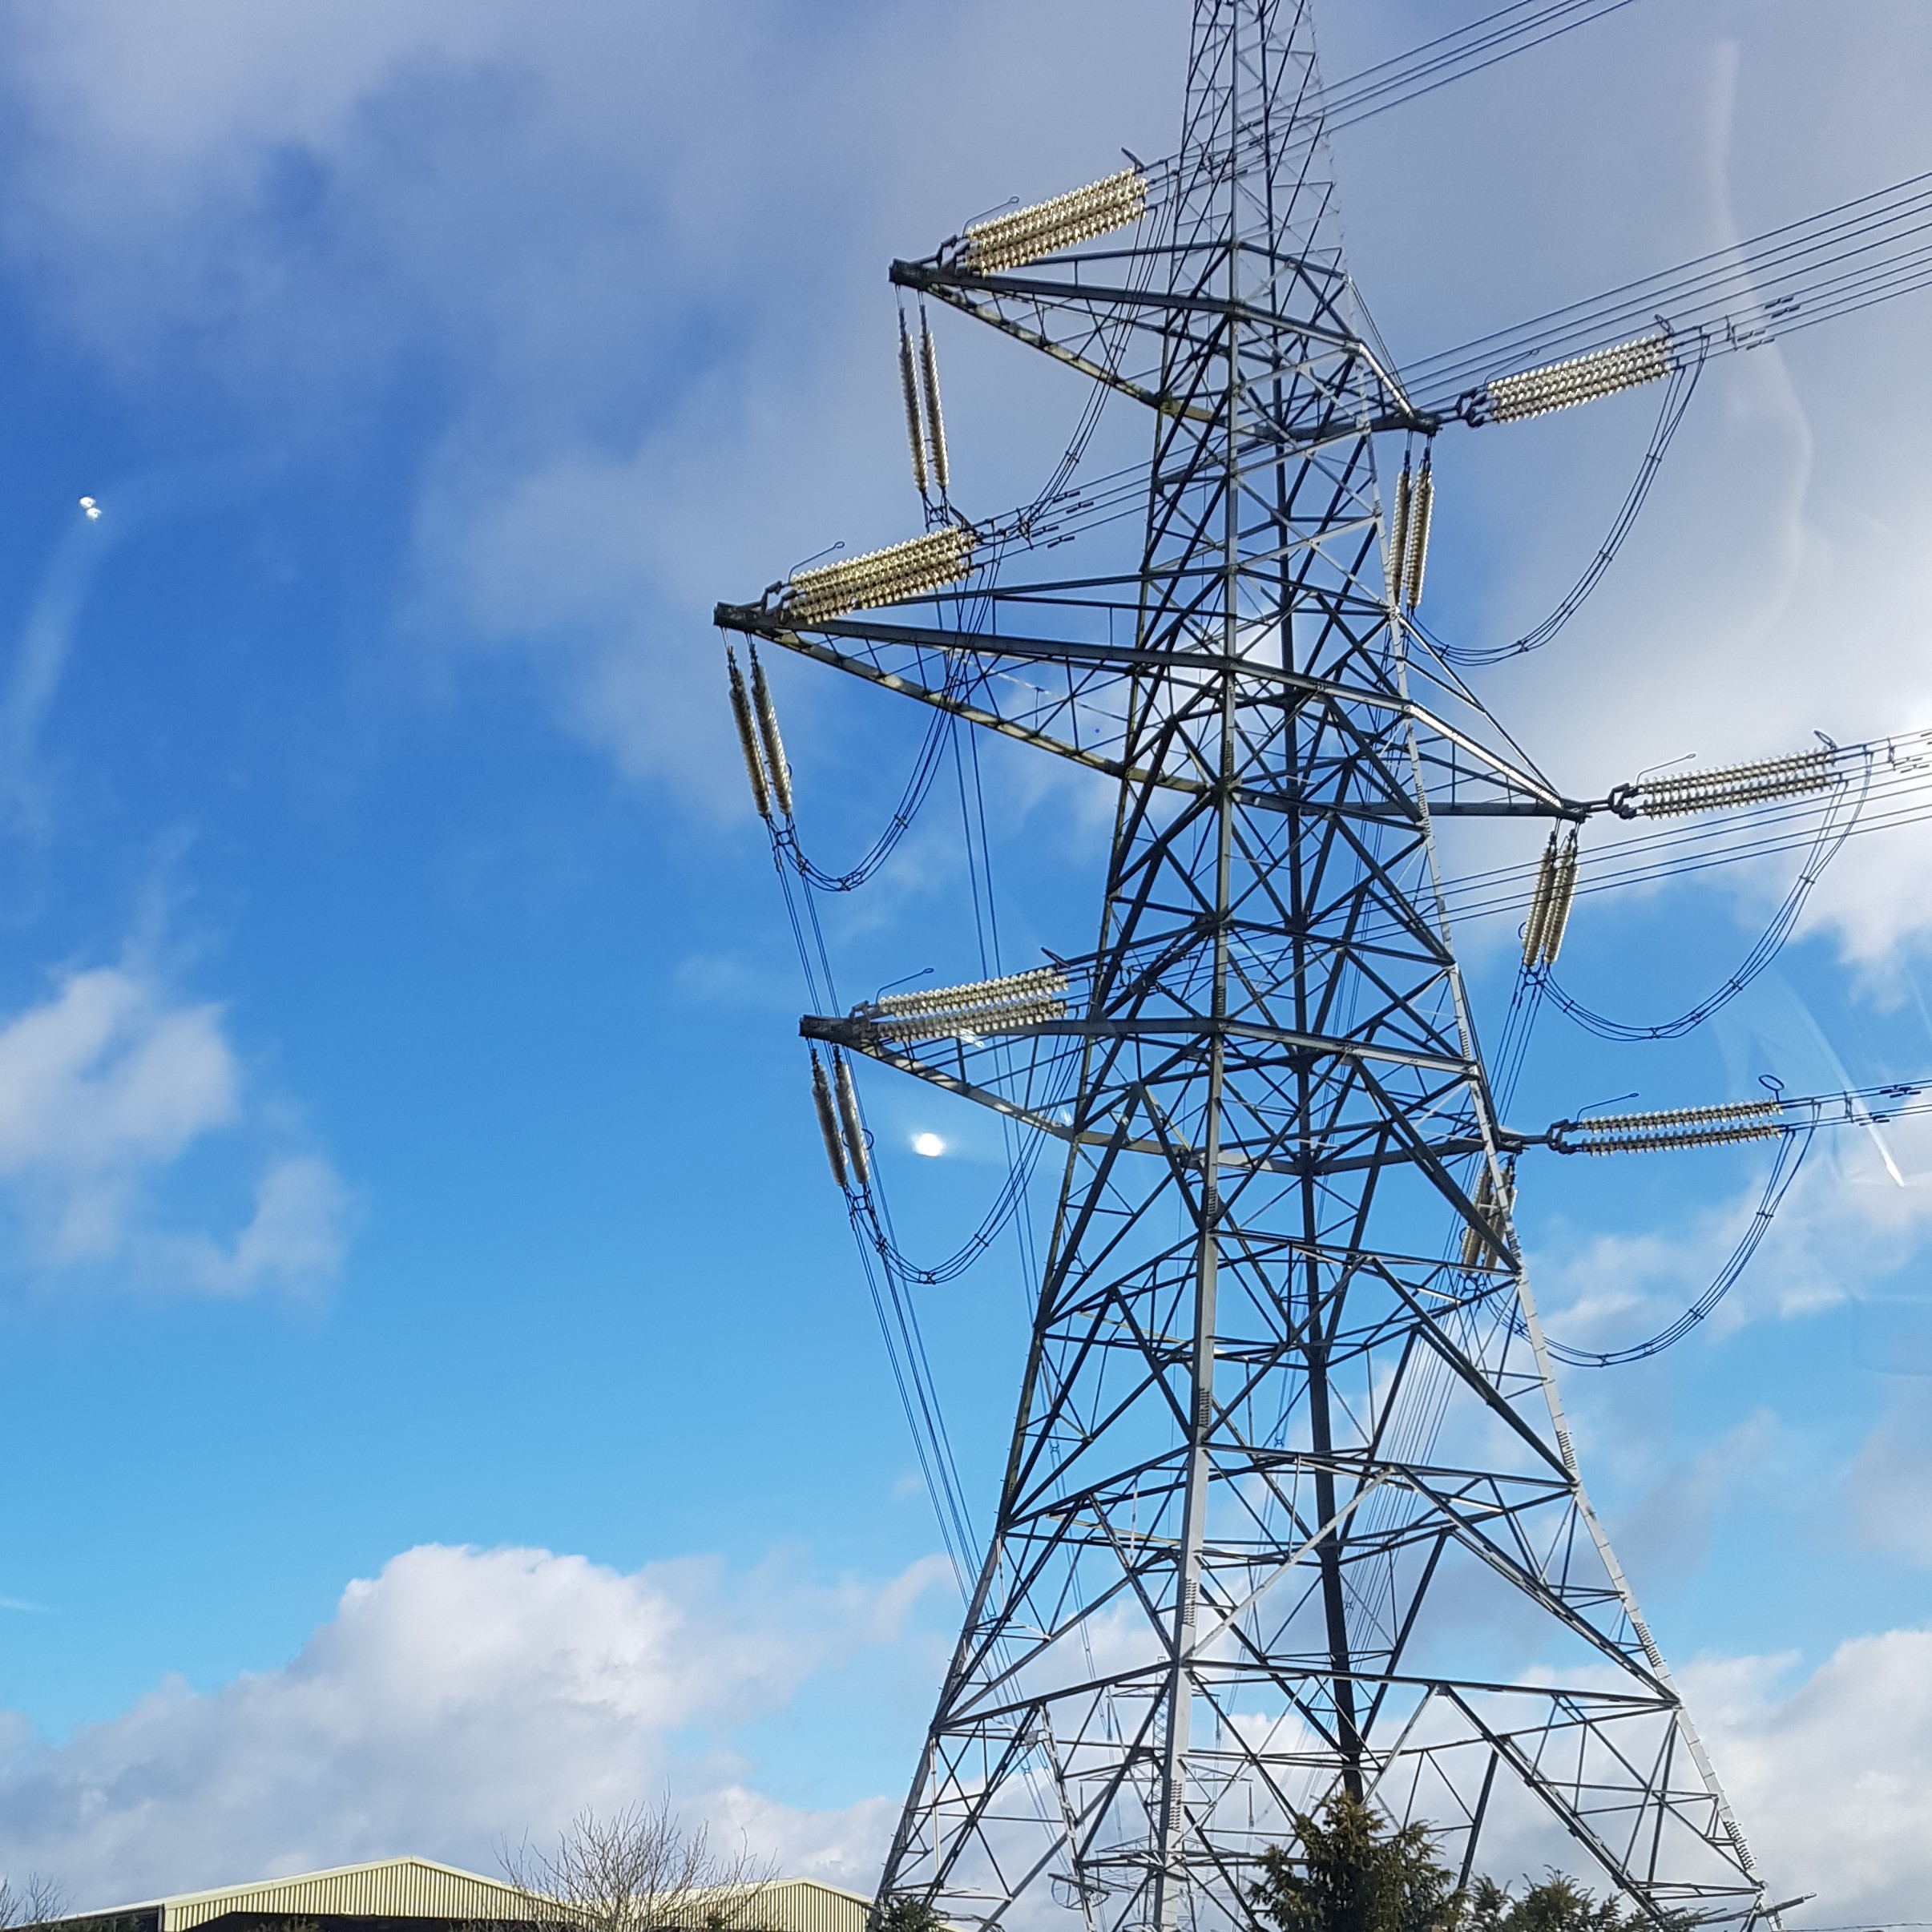
Did the weather have to do with it? The ESO control room is provided with lightning strike forecasts. It comes from the Meteogroup in the form of geographical region stating the likelihood of a strike, represented on a scale of 1 to 5. A few minutes prior to the strike, the details sent across were ‘1’ signifying that the highest risk of lightning was predicted practically everywhere in England. Within the two hours prior to 5pm the main land UK had 2,160 strikes. So when the lightning strike on the transmission circuit occurred hitting a pylon near St Neots, it wasn’t a surprise.
Lightning strikes are routinely managed as part of everyday system operations. The eventuality is factored in by the ESO. The Protection System detected the fault and operated as expected within the 20 seconds time-limit, as specified by the grid code. The embedded generation which was part of the response to the strike, had a small issue on the distribution system. A 500MW in reduction of generated electricity was recorded. The monitoring system calculated the frequency, on the grid, which was in tolerance and any voltage disturbances were within industry standard, the Loss of Mains protection that was triggered was on cue. The ESO state this was all handled as expected in the response to the lightning event, and the incident was handled to restore the network to its pre-event condition.
The catalyst to the wide scale power problems was the unrelated independent problems that occurred at two separate sites just minutes later. Not one but two disparate power plants had a problem at nigh on the same time.
An off-shore wind farm (Hornsea) and a gas power station (Little Barford) meant the National Grid lost a combined 1691MW, as these two sites started under generating. (For the record these losses are attributed to the consequences of the lightning strike but the industry is asking the question of compliance, nothing is clarified yet). These generators fell off the grid and the frequency fell. As demand was now greater than the electricity generated the frequency fell below the tolerance value. To correct the frequency, the ESO did its job by prioritising disconnection of major load, it had to reduce demand by 1000MW. This equated to 5% of the consumption at that time, hopefully you were in the protected 95% that was kept powered !
Why wasn’t generation increased?
Reserves are already part of most plants, the solution would be to have more reserves available, right. Yes, but it is cheaper to just turn-off the load. It is also instantaneous, not too unlike having an overload on your UPS, you react by unplugging the load and then contemplate whether you need a higher capacity UPS. Not every power source can produce enough energy to stabilise the ‘demand-generation’ equation. Ramping up generation represents a significant outlay, sometimes the costs are inexact particularly when considering solar/wind plants due to forecast uncertainty and lest we forget every power plant is a business that needs to make money.
A note about renewable energy: the National Grid supply was originally set-up for fossil-fuel, the integration of renewable energy into the system is not simple. There are technical discussions relating to inertia, stability, ongoing compliance monitoring that needs to be addressed by policy makers and operators etc. before we see large scale deployment. 30% deployment seems to be the uptake globally on average in any country, more than this will require changes to system operations and market designs. Comforting to know that the National Grid is already being adapted and is expecting to be a carbon-free grid in the next 6 years.
Reducing demand
Each geographical region of the country is unique. The frequency recovery in different area is dependent on the transmission voltage, the transmission lines, energy generation and voltage support etc. Routine maintenance is carried out on circuits and equipment rendering them out of service. Simply put, each region will react differently when the demand and generation is altered. The ESO is set up to manage faults and control demand. This is done in a predetermined manner based on knowledge about the limitations of all these region, those that lost power were scheduled to lose power.
Large users of electricity actually know the score when they connect to the grid. In these situations, the ESO will trigger the Distribution Network Operators (DNOs) to power-down companies who have contracts agreeing that they can have their energy cut-off to stabilise the grid i.e. balance the frequency. It doesn’t matter if it’s peak time in London’s Stations the agreement is to ‘pull the switch’ to non-essential supplies. The ESO signals to the DNO to stop powering those companies when it needs to control demand. The agreement is to cut-off for 30 minutes.
Further delays experienced by London’s commuters past this half an hour is reported to be the result of those companies having to restart their systems after the period of being cut-off. Certain new class of trains needed technicians to manually reboot approx. 80 trains on site and individually. On occasions the train companies had shifted supply to backup power but then when the grid was back the trains had complications switching onto grid power.
Companies would rather have the power cut than sustain long term equipment damage. Even so, it is unacceptable to the trainline operators and they did demand answers as the scale of disruption was phenomenal.
The report suggests that the ‘critical loads’ were affected for several hours because of their customers’ system’s shortcomings as the DNOs had only pulled the switch for 30 minutes. It also suggests that no critical infrastructure or service should be placed at risk of unnecessary disconnection by DNOs.
There are plans afoot to address the shortcomings highlighted by the report, we can only wait to see whether a powercut on this scale reoccurs. Modern technology can only facilitate improvements. Many of us have Smart Meters installed, the data these feedback will allow smart management. These would give the DNOs opportunity to improve reliability and switch-off only the non-critical loads when their network is being put under stress. Hey, you didn’t believe that those temperamental meters were just a freebie for you to cut-back usage and reduce your fuel bills, did you?
Need any idea how long your UPS will last for? Eg How much runtime will you get out of your UPS? Then this UPS Runtime Calculator is just what you need.
You’ll need to know how much power (in Watts) your UPS is delivering. Then you’ll need to know how many battery blocks and of what Ampere Hour capacity are in your UPS.
This calculator is based upon 12V blocks only and will only accept integer values. So, if you have one single 6V battery of 12Ah capacity, then you’ll need to say it’s a 12V 6Ah battery. If the spec of your battery is not in Ampere Hours but Watt Hours, then as a very rough guide divide the Wh rating by 4 to get the Ah. If you have 7.2Ah or 8.5Ah then if you round down this will give you a minimum, and round up will give you a maximum.
Note, the calculator is approximate. There are no assumptions made on standby current consumption and inverter efficiency. These will be different for different UPS and also different at different load levels. Please just use as a guide. For example if you have an AC load of 1000W, the calculator makes no allowance for DC to AC conversion losses. This allows you to add your own. For example if your system uses 5W in standby, and has an efficiency of 90% then for a 1000W AC load, use 1000 / 0.9 + 5 = 1116W.
If your load varies over time, you’ll need to estimate the average power consumption. You’ll need to size a UPS to meet the maximum power draw expected, but calculate the runtime based upon the average power consumption.
UPS Runtime Calculator
If you want to select a UPS to meet load and runtime calculators please use the UPS Selection Tool.
If you’ve used the UPS Runtime Calculator please leave a comment or drop us a line with any ideas.
Did you know that majority of UPS’s trouble shootings are battery related? Typical life span of UPS internal batteries ranges from 3 to 5 years; however this depends on numerous factors. Here are a few easy tips to ensure that you get the most out of your batteries and therefore your UPS system:
Selecting the correct UPS technology:
Uninterruptible Power Supply systems operate in battery mode in two major situations: if the power goes off, or if the mains power input goes out of tolerance. This could mean for example too low or too high voltage, or frequency anomaly (e.g. running off a generator). Some UPS technologies can provide wider input voltage and/or frequency window, which resolves this issue. Example of such technology is online UPS technology – for example our VFI series. Selecting the correct UPS technology for your equipment will ensure the UPS only works off battery in case of emergency. This will prolong the battery’s lifetime.
Positioning of UPS:
While installing your UPS be sure to take into account the following factors: your Uninterruptible Power Supply system should be positioned in temperature stable, dry environment. Position your unit so that all ventilations and fans are clear to prevent overheating. The environment should be clean and dry, with no excessive dust or corrosive fumes. If you require the UPS system to be located outdoors, use appropriate storing cabinet – for example our Willo. Small cupboards or other enclosed spaces other than the ones specifically designed for such purposes with ventilations and cooling technologies are not suitable for storing your UPS system.
Temperature:
Although specifications for Uninterruptible Power Supply systems usually state temperature between 0°-40°C, it is ideal to keep the ambient temperature between 20 °– 25°C. This will ensure that the UPS will function properly and the battery won’t deplete due to the heat. High temperature drastically reduces battery life – essentially for each 10°C over 30°C, battery life halves. In extreme cases the batteries may start swelling due to a thermal runaway. To prolong battery life, aim to keep your UPS system in an environment with temperature between 20°-25°C.
Use of UPS:
The way you use your UPS can have a huge effect on your UPS’s battery life. We recommend that during a power cut you never leave your UPS battery to completely deplete to 0%. Power cuts are usually momentary in which case you don’t need to worry about this, but if you suffer from frequent and prolonged power outage, you should take the time to switch off your equipment and then turn off the UPS to ensure that the batteries don’t deplete completely if possible. Please note that batteries only have so many charge-discharge cycles which are higher the less the battery is discharged. If you don’t discharge to zero you will get more cycles out of your batteries.
Storing UPS:
Should your UPS not be in use for a long period of time, we strongly recommend to charge the batteries before storage. Never leave a UPS disconnected from mains for a long period in a discharged state.
Service:
A battery service after few years of use is a necessity to ensure that your UPS is functioning correctly. For more information read our previous blog post about our UPS battery services.
A line interactive Uninterruptible Power Supply is characterised by its ability to raise the input voltage when it is too low, and to lower the input voltage when it is too high. This provides a degree of voltage regulation. This process is sometimes known as Automatic Voltage Regulation or AVR, however some manufacturers of AVR equipment may – and probably do – object to this as a line interactive UPS is a very loose AVR whereas a dedicated AVR device offers tight control on output voltages. A better description for a line interactive UPS System would be a “buck and boost” device.
Here in this article I’m going to try and explain what one of our UPS does and for this I’m going to take the VIS2000B, apply varying voltage to it and observe the unit response. The VIS2000B is a good choice as the LCD display lets us know both input and output voltage so we don’t need to add any multimeters to the circuit. We’re going to modify the input voltage by means of a variable transformer, or a Variac. If you’re trying this at home don’t use a dimmer switch as these work in a different way.
Firstly we set the variac to nominal voltage, connect to the VIS2000B and switch it on. The display shows input voltage on the left at 230V and the output voltage on the right at 230V.
This is normal operation and so what comes in, goes out. What we will do now is increase the input voltage and observe.
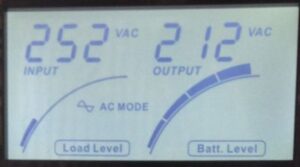
As the voltage is increased the output voltage matches the input voltage until the buck trigger threshold is reached. This is set to be around the maximum voltage that the utility should provide which is 230 +10% = 253V.
In our case at 252V the unit enters buck mode and reduces the high input voltage to 212V. [Also note that on VIS2000B the AC Mode indicator blinks.]
The lower threshold of voltage supplied by the utility is open to some debate. It is 230V -10% = 207V in much of Europe and was supposed to be the same in the UK. However the implementation date of about 8 years ago has come and gone and so officially in the UK the voltage is still set to be 230V – 6% = 216V. However other standards for products that are CE marked generally require equipment to be able to operate across the full spectrum of nominal voltages, so the output is aimed to be regulated within the realm of the EU, so 230±10% or 207V to 253V.
Raising our test variac to as high as it could go saw the unit maintain in buck mode with the output voltage rising proportionally with the input. In buck mode the input voltage is reduced by a nominal 16% or so.
Raising the input voltage even higher results in the unit disabling buck mode and reverting to battery operation.
As we reduce the input voltage the buck will at some point be deactivated and the unit will return to normal. There must be some hysteresis built into this or the unit would “chatter” eg switch constantly in and out at the threshold voltage.
In our test with the unit output reaching 207V a further reduction in input voltage caused the unit to switch out of buck mode and back into normal mode.
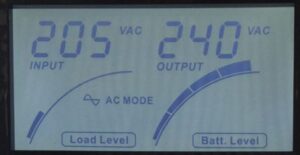
With the mains input voltage reduced further the output voltage tracks the input voltage until the boost threshold is reached at around the 207V mark.
Here the mains input is raised by around 17-18% in order to maintain the voltage within the nominal range.
Further reductions in the input voltage will keep the unit in boost mode until the output voltage can no longer be maintained within tolerance and the unit will revert to battery operation.
Raising the voltage the unit comes out of battery mode, straight into boost which then is disabled when the input voltage reaches around 211V.
To summarise, a line interactive unit attempts to maintain the output voltage within regulated limits for as long as possible without dropping to battery power. This is an advantage of over offline UPS systems that will have no option but to drop to battery instead of providing regulation, which would resort in lost loads due to UPS switching off due to depleted battery, or diminished battery life if the unit is regularly switching in and out of battery mode. However, they do not provide tight output voltage control. To achieve this online double conversion UPS systems provide a constant fixed output voltage regardless of the input voltage level.
Additional Notes with regard to the VIS2000B
One of the drawbacks of UPS Systems is the need for them to prevent a build up of heat and so many are fitted with forced cooling fans. In our VIS2000B the unit fan activates when the unit is “active” that is, on battery but also when it is in buck or boost mode. Users may find their unit enters buck mode when their mains is around the 250V mark as this will be activated should the mains hit 252V even momentarily. Due to the hysteresis effects the fan will not be disabled until the lower threshold is reached which is around the 246V mark. If this occurs, briefly switching the unit onto battery power will clear the hysteresis effect.
Note that we can change the threshold somewhat to effectively shift the buck and boost points higher by around 10V or so. This prevents the unit entering a nuisance buck mode and also makes the minimum output voltage more within the current UK spec but this does mean that the unit will allow voltages of 260+V through, should these be encountered. This is a factory setting that the Power Inspired technicians would be happy to undertake for you if required.


